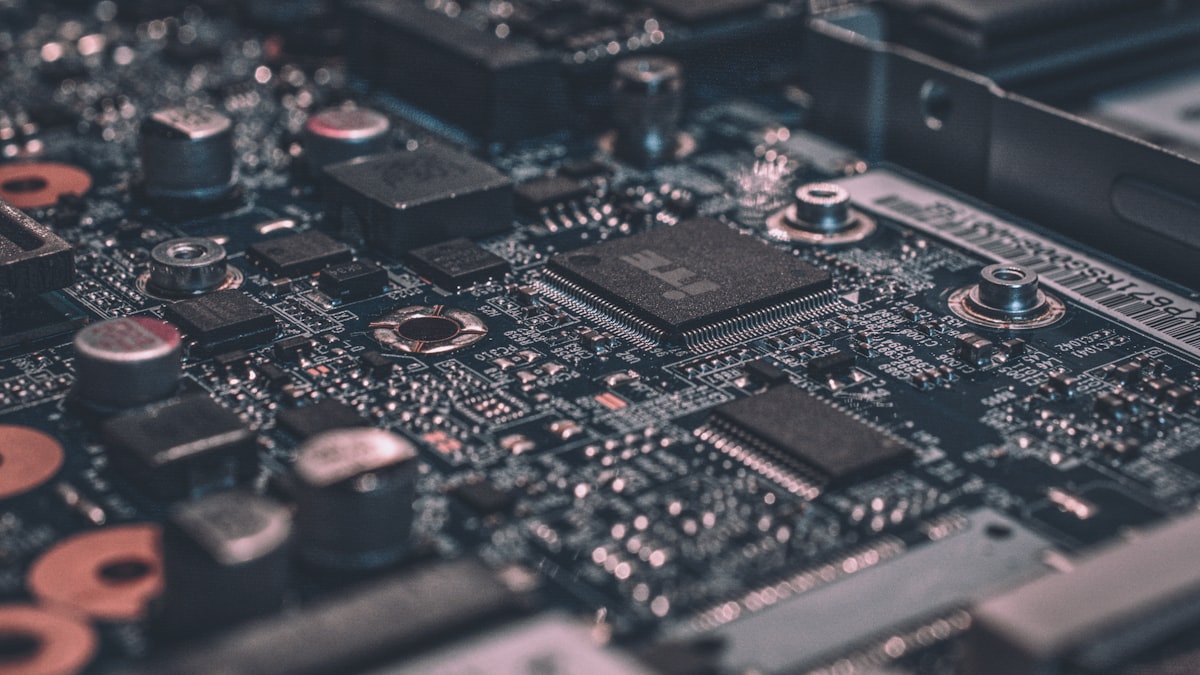
Why the India vs Indonesia Decision Matters for Electronics Manufacturers
The global electronics supply chain is undergoing its most significant restructuring in three decades. With 55% tariffs on Chinese-made electronics entering the United States and geopolitical pressure accelerating the China+1 strategy, manufacturers face a consequential decision: where to build the next generation of electronics assembly capacity. India and Indonesia — ranked sixth and seventh respectively in the Asia Manufacturing Index 2026 — are the two leading contenders outside of Vietnam.
The stakes are substantial. India's electronics production surged from INR 2.13 lakh crore (USD 26 billion) in FY 2021 to INR 5.25 lakh crore (USD 63 billion) in FY 2025 — a 146% increase. Indonesia's semiconductor market reached USD 5.08 billion in 2025, with electronics exports of USD 10.07 billion in Q3 2024 alone. Both countries offer 100% FDI in manufacturing under the automatic route, but the incentive structures, cost profiles, and market access advantages diverge sharply.
This analysis provides the data-driven comparison CFOs and investment committees need to make this decision. For a broader look at India's manufacturing incentives, see our guide to government incentives beyond PLI.
FDI Policy Framework: Side-by-Side Comparison
Both India and Indonesia permit 100% foreign ownership in electronics manufacturing, but the regulatory architecture differs in material ways.
India's FDI Framework for Electronics
India allows 100% FDI under the automatic route for all manufacturing activities — no prior government approval required. Foreign investors can establish a wholly owned subsidiary as a private limited company, requiring minimum two directors (one resident director), INR 1 lakh minimum paid-up capital, and filing of FC-GPR with RBI within 30 days of share allotment. The India-EFTA Trade and Economic Partnership Agreement (TEPA), effective October 1, 2025, has opened additional investment channels with a commitment of USD 100 billion in investment over 15 years.
Indonesia's FDI Framework for Electronics
Indonesia's Omnibus Law on Job Creation (Law No. 11/2020) reformed the investment framework significantly. Most manufacturing sectors including electronics are now open to 100% foreign ownership under the Positive Investment List. However, Indonesia imposes minimum capital requirements: total investment value must exceed IDR 10 billion (approximately USD 610,000) excluding land and buildings, with minimum issued and paid-up capital of IDR 2.5 billion (approximately USD 153,000). Business licensing follows Regulation No. 5 of 2025, introduced in October 2025.
Key FDI Differences
| Parameter | India | Indonesia |
|---|---|---|
| Maximum foreign ownership | 100% (automatic route) | 100% (most manufacturing) |
| Minimum capital requirement | INR 1 lakh (~USD 1,200) | IDR 10 billion (~USD 610,000) |
| Government approval needed | No (automatic route) | No (positive list sectors) |
| Company formation timeline | 7-10 days (SPICe+) | 4-8 weeks |
| Resident director requirement | Yes (minimum 1) | Yes (local domicile required) |
| FDI reporting | FC-GPR + annual FLA Return | BKPM quarterly reports |
The capital requirement differential is striking. India's INR 1 lakh minimum (approximately USD 1,200) is essentially a formality, while Indonesia's IDR 10 billion threshold (approximately USD 610,000) represents a meaningful entry barrier for smaller manufacturers. For entity structuring decisions, see our branch office vs subsidiary comparison.
Incentive Programmes: PLI and ECMS vs Indonesia Tax Holidays
This is where the two countries diverge most dramatically. India has deployed sector-specific production-linked incentives of unprecedented scale. Indonesia relies on broader corporate tax incentives tied to investment size.
India's PLI and ECMS Incentives
India operates two complementary schemes for electronics manufacturing:
PLI for Large Scale Electronics Manufacturing (PLI 1.0) — launched in 2020 with INR 34,193 crore outlay, offering 4-6% incentive on incremental sales over base year. By FY 2025, over INR 5,000 crore has been disbursed to manufacturers including Foxconn (INR 2,807 crore), Tata Electronics (INR 2,068 crore), Samsung, and Dixon Technologies. PLI 1.0 expires March 2026, with a successor scheme linking incentives to domestic value addition rather than pure turnover.
Electronics Component Manufacturing Scheme (ECMS) — approved March 2025 with INR 22,919 crore (USD 2.75 billion) outlay, targeting upstream components: multi-layer PCBs, passive components, display and camera modules, lithium-ion cells. Offers turnover-linked incentive at 4-8% plus capex incentive at 25% of eligible capital expenditure. As of January 2026, 46 applications approved with committed investment of INR 54,567 crore. For detailed ECMS analysis, see our PLI Phase 2 guide.
Indonesia's Tax Holiday and Incentive Programme
Indonesia's incentive structure takes a different approach — broader corporate tax reductions rather than sector-specific production incentives:
- Tax holiday: 100% corporate income tax (CIT) reduction for investments exceeding IDR 500 billion (~USD 30.5 million) for periods of 5 to 20 years, depending on investment scale and sector priority
- Tax allowance: 50% CIT reduction for investments between IDR 100 billion and IDR 500 billion for 5 years
- Additional allowances: 30% deduction from investment value spread over 6 years, reduced withholding tax on dividends (10%), and accelerated depreciation
- Special Economic Zones: Over 19 operational SEZs including Batam (electronics hub near Singapore) offering duty-free imports, reduced corporate tax, and simplified customs
Incentive Comparison Table
| Incentive Parameter | India (PLI + ECMS) | Indonesia (Tax Holiday) |
|---|---|---|
| Structure | Production-linked (% of sales) | Tax reduction (% of CIT) |
| Small investment benefit | Available from INR 1 crore capex | Requires IDR 100 billion minimum |
| Large investment benefit | 4-8% of incremental turnover | Up to 100% CIT holiday for 20 years |
| Capex subsidy | 25% under ECMS | 30% deduction over 6 years |
| Duration | 5-6 years | 5-20 years |
| Sector specificity | Electronics-specific | Available to 246 priority business lines |
India's model directly subsidises production volume, making it more valuable for high-throughput assembly. Indonesia's model reduces the tax burden over a longer horizon, which benefits capital-intensive investments that take years to reach profitability. The choice depends on your capital intensity and ramp-up timeline.
Corporate Tax and Effective Tax Rates
Beyond incentives, the standard tax framework significantly affects long-term manufacturing economics.
| Tax Parameter | India | Indonesia |
|---|---|---|
| Standard corporate tax rate | 22% (Section 115BAA) | 22% |
| New manufacturing company rate | 15% (Section 115BAB) — closed to companies not manufacturing by 31 Mar 2024, not extended | 22% (no special rate) |
| Effective rate (incl. surcharge/cess) | ~17.16% (115BAB, window now closed) / ~25.17% (standard 115BAA) | ~22% (standard) / ~19% (listed + 40% public float) |
| MAT / minimum tax | 15% (but exempt for 115BAB) | No formal MAT |
| Capital gains (long-term) | 12.5% on listed / 12.5% unlisted (without indexation, post Finance Act 2024) | 25% on shares |
| Dividend distribution | Taxed in shareholder hands | 20% WHT (reducible under DTAA) |
| GST/VAT rate | 18% (most electronics, incl. mobiles) | 11% VAT (increased from 10%) |
India's 15% concessional rate for new manufacturing companies (Section 115BAB) provides a clear advantage — but eligibility requires incorporation after October 2019 and commencement of manufacturing before March 2024. New entrants who missed this deadline face the standard 22% rate. For current tax structuring advice, consult our tax advisory services.
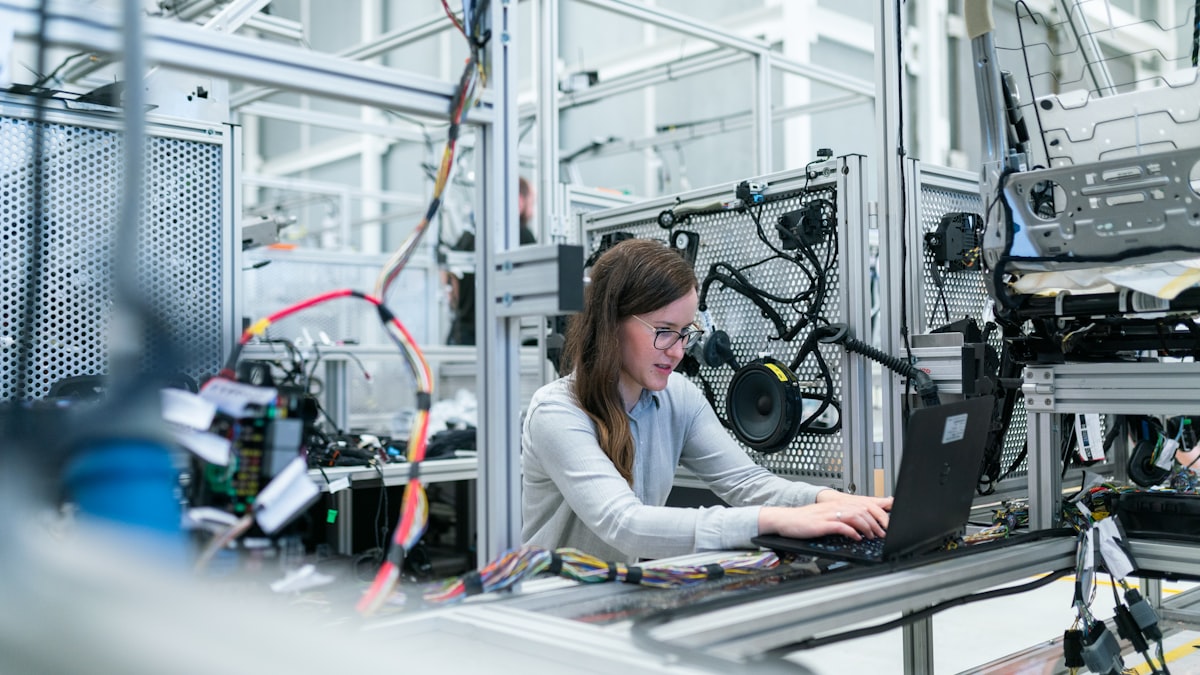
Labour Costs and Workforce Quality
Electronics assembly is fundamentally labour-intensive. Both countries offer significant cost advantages over China, but with different labour market characteristics.
| Labour Parameter | India | Indonesia |
|---|---|---|
| Manufacturing hourly wage | ~USD 1.00/hour | ~USD 1.20-1.50/hour |
| Assembly line operator (monthly) | INR 12,000-18,000 (~USD 145-215) | IDR 3.27 million (~USD 200) |
| Minimum wage (key metro) | INR 17,494/month (Delhi) | IDR 5.07 million/month (Jakarta, ~USD 310) |
| Employer statutory costs | 20-30% above gross (EPF, ESI, gratuity) | ~15-20% above gross (BPJS) |
| Total manufacturing workforce | 60+ million | 18+ million |
| Annual STEM graduates | 2.55 million | ~700,000 |
| Labour law flexibility | Moderate (new Labour Codes pending) | Moderate (Omnibus Law reforms) |
India's labour cost advantage is modest — approximately 15-20% lower than Indonesia on a per-hour basis. But the scale advantage is decisive: India's manufacturing workforce of 60+ million dwarfs Indonesia's 18 million, and India produces 2.55 million STEM graduates annually compared to Indonesia's approximately 700,000. For labour-intensive assembly operations requiring 10,000+ workers, India offers deeper recruitment pipelines across multiple cities. Foxconn's new Bengaluru facility alone plans to employ 50,000 workers by 2027, a scale of hiring that would be challenging to replicate in any single Indonesian industrial zone outside Java.
Supply Chain and Component Ecosystem
Electronics assembly economics depend critically on component sourcing. Both countries face import dependency challenges, but at different stages of building domestic supply chains.
India's Component Ecosystem
India imports over 75% of electronic components, primarily from China, Taiwan, South Korea, and Japan. However, the ecosystem is evolving rapidly. The ECMS scheme targets this gap directly, and 276 operational SEZs support manufacturing. Apple's iPhone assembly ecosystem illustrates what's possible: Foxconn's Bengaluru facility produces 500 units per hour with plans for 50,000 workers by 2027. India assembled iPhones worth USD 22 billion in the 12 months ending March 2025. Key clusters include Tamil Nadu (Foxconn, Tata, Pegatron), UP (Samsung, Dixon), and Karnataka (design and R&D).
Indonesia's Component Ecosystem
Indonesia's electronics manufacturing centres on Batam (free trade zone near Singapore) and Java (Cikarang industrial belt). Samsung's Cikarang plant ships 1.56 million units per year with 40.3% local content (TKDN). STMicroelectronics is upgrading Batam facilities for silicon-carbide testing. However, Indonesia's component base is narrower — strong in connectors, cables, and basic assembly, but limited in PCBs, display modules, and passive components. The semiconductor market is projected to grow from USD 5.08 billion (2025) to USD 7.07 billion by 2030.
Supply Chain Comparison
| Factor | India | Indonesia |
|---|---|---|
| Import dependency (components) | ~75% | ~70-80% |
| Domestic PCB capacity | Growing (20+ manufacturers) | Limited |
| Smartphone assembly scale | 55 million+ iPhones/year | ~10 million Samsung units/year |
| SEZ/FTZ infrastructure | 276 operational SEZs | 19+ operational SEZs |
| Port connectivity | Good (Chennai, Mumbai, Mundra) | Good (Tanjung Priok, Batam) |
| Proximity to key suppliers | Moderate (2-4 day shipping from East Asia) | Good (Batam is 1 hour from Singapore) |
Indonesia's Batam advantage — its proximity to Singapore — is significant for just-in-time component sourcing. But India's sheer scale of assembly operations and the ECMS-driven component build-out tilts the medium-term supply chain advantage toward India. For import procedures, see our IEC guide.
Market Access: Domestic and Export Markets
Where you manufacture determines which markets you can serve efficiently — and at what tariff rates.
Domestic Market Size
India's GDP of USD 3.91 trillion (2025) is approximately 2.8 times Indonesia's USD 1.4 trillion. India's electronics demand is projected to reach USD 400 billion by 2026, driven by 1.2 billion smartphone users and rapid digital infrastructure expansion. Indonesia's electronics demand, while smaller in absolute terms, benefits from a younger median age (29.7 years vs India's 28.4) and growing middle class of approximately 100 million consumers.
Export Market Access
India's position for US-bound electronics exports has transformed dramatically. India overtook China as the leading smartphone exporter to the US in Q2 2025, capturing 44% market share vs China's 25%. Indian-made electronics face only 10% tariffs entering the US, compared to 55% for Chinese-made products. Apple aims to shift the bulk of US-bound iPhone production to India by end of 2026.
Indonesia benefits from ASEAN free trade agreements and proximity to the ASEAN market of 680 million consumers. Its RCEP membership provides preferential access to Australia, New Zealand, Japan, South Korea, and China. However, Indonesia lacks a direct trade agreement with the EU — a gap India partially addresses through the EFTA agreement.
| Market Access | India | Indonesia |
|---|---|---|
| Domestic electronics market | ~USD 400 billion (projected 2026) | ~USD 50 billion |
| US tariff on electronics | 10% | Varies (0-25%) |
| EU trade agreement | India-EFTA TEPA (Oct 2025) | No direct FTA with EU |
| ASEAN market access | India-ASEAN FTA | Full ASEAN member |
| RCEP membership | No | Yes |
For companies primarily targeting the US market, India offers a clear advantage post-tariff restructuring. For companies focused on ASEAN and East Asian markets, Indonesia's RCEP membership and geographic position provide stronger access. For country-specific entry planning, visit our USA country guide.
Infrastructure and Power
Manufacturing reliability depends on infrastructure quality. Both countries have invested heavily but differ in specific capabilities.
Key Infrastructure Metrics
| Infrastructure | India | Indonesia |
|---|---|---|
| Industrial power cost | INR 6-9/kWh (~USD 0.07-0.11) | USD 0.08-0.12/kWh |
| Power reliability | Improving (renewable additions) | Good in Java/Batam, variable elsewhere |
| Internet connectivity | Strong (5G rollout underway) | Moderate (4G dominant, 5G emerging) |
| Logistics Performance Index | Rank 38 (2023) | Rank 46 (2023) |
| Key industrial corridors | DMIC, Chennai-Bengaluru, NIMZ | Java Industrial Belt, Batam FTZ |
India has the edge in logistics performance and digital infrastructure. Indonesia's archipelagic geography (17,000+ islands) creates logistical complexity that Java and Batam largely avoid, but expansion to secondary locations can be challenging. India's dedicated freight corridors — the Eastern and Western DFCs — are specifically designed to move manufactured goods from industrial clusters to ports, reducing transit times by 40-50% when fully operational.
For electronics assembly specifically, power reliability is critical. Unplanned outages can damage sensitive manufacturing equipment and disrupt production lines. India's power surplus in key manufacturing states (Tamil Nadu, Karnataka, Gujarat) and growing renewable energy capacity (over 200 GW installed as of 2025) provide stable supply for large manufacturing operations. Indonesia's Java-Bali power grid is similarly reliable, but facilities in outer islands may face intermittent supply challenges.

Regulatory Compliance and Ongoing Costs
Long-term operational costs include ongoing regulatory compliance. Both countries impose reporting obligations on foreign-owned manufacturers, and the burden differs substantially in both volume and complexity.
India's Compliance Requirements
India requires annual FLA Return filing with RBI by July 15 each year, FEMA compliance for all cross-border transactions including dividend remittance and intercompany payments, transfer pricing documentation for related-party transactions (Form 3CEB due by November 30), BIS product certification for all electronics sold domestically, monthly GSTR-3B and quarterly GST returns, and annual income tax return with audit report. Electronics manufacturers selling products in India must also comply with BIS Compulsory Registration Scheme (CRS) for 56 categories of electronic goods, requiring re-testing every two years.
Indonesia's Compliance Requirements
Indonesia requires BKPM quarterly investment realisation reports, TKDN (Tingkat Komponen Dalam Negeri) local content compliance — Samsung achieved 40.3% TKDN for its Galaxy models manufactured at Cikarang, SNI product standards certification, annual corporate tax filings with Directorate General of Taxes, and periodic manpower reporting to the Ministry of Manpower. Indonesia also requires foreign-owned companies to submit annual investment activity reports detailing progress against original investment commitments.
India's compliance burden is arguably heavier — particularly around FEMA reporting and transfer pricing. However, India's digital filing infrastructure (MCA21, GST Network, income tax portal) is more mature than Indonesia's predominantly paper-based systems. The practical advice for both countries: budget INR 15-25 lakh (India) or IDR 300-500 million (Indonesia) annually for professional compliance services. For compliance support, see our FEMA/RBI compliance services.
Key Takeaways
- Choose India if: You are targeting the US export market (10% tariff vs 55% from China), need access to India's USD 400 billion domestic electronics market, want PLI/ECMS production-linked incentives (4-8% of sales), or require deep assembly-line labour pools
- Choose Indonesia if: You are focused on ASEAN/RCEP markets, investing over IDR 500 billion (USD 30.5 million) to qualify for up to 20-year tax holidays, need proximity to Singapore for just-in-time component sourcing via Batam, or are building EV battery supply chains leveraging Indonesia's nickel reserves
- Both countries offer 100% FDI in electronics manufacturing, but India's minimum capital requirement (INR 1 lakh) is dramatically lower than Indonesia's (IDR 10 billion)
- India's PLI model subsidises production volume (ideal for high-throughput assembly), while Indonesia's tax holiday model reduces long-term tax burden (ideal for capital-intensive, longer-gestation projects)
- For US market access, India now holds a decisive advantage after tariff restructuring, with 97% of India-made iPhone exports going to the US market
For FDI advisory on structuring your India electronics manufacturing investment, or company registration to establish your subsidiary, contact our team for a consultation.
Frequently Asked Questions
Is 100% FDI allowed in electronics manufacturing in both India and Indonesia?
Yes. India permits 100% FDI in electronics manufacturing under the automatic route with no prior government approval. Indonesia also allows 100% foreign ownership in most manufacturing sectors under its Positive Investment List following the Omnibus Law on Job Creation. However, Indonesia requires minimum investment of IDR 10 billion (~USD 610,000), while India requires only INR 1 lakh (~USD 1,200).
How does India's PLI scheme compare to Indonesia's tax holidays for electronics?
India's PLI offers production-linked incentives of 4-8% on incremental sales, directly subsidising manufacturing output. Indonesia's tax holiday offers up to 100% corporate income tax reduction for 5-20 years for investments exceeding IDR 500 billion. India's model benefits high-volume assembly; Indonesia's model benefits capital-intensive projects with longer gestation periods.
Which country has lower labour costs for electronics assembly?
India has marginally lower labour costs at approximately USD 1.00 per hour for manufacturing workers, compared to USD 1.20-1.50 in Indonesia. India also offers a larger talent pool with 2.55 million STEM graduates annually and a total manufacturing workforce of over 60 million, compared to Indonesia's 18 million.
Which country offers better US market access for electronics exports?
India has a clear advantage for US-bound exports. Indian-made electronics face only 10% tariffs entering the US, compared to 55% for Chinese-made products. India overtook China as the leading smartphone exporter to the US in Q2 2025, capturing 44% market share. Apple aims to shift the bulk of US-bound iPhone production to India by end of 2026.
What is the corporate tax rate for manufacturing companies in India vs Indonesia?
India's standard corporate tax for companies opting in is 22% under Section 115BAA (effective ~25.17% with surcharge and cess). The concessional 15% rate for new manufacturing under Section 115BAB (effective ~17.16%) was available only to companies that commenced manufacturing by 31 March 2024 — that window has closed and was not extended, so new manufacturers now default to 22%/25.17%. Indonesia's standard corporate tax rate is 22% for all companies, with no special reduced rate for manufacturers.
Is Batam in Indonesia better than Indian SEZs for electronics manufacturing?
Batam's key advantage is geographic — it is located just one hour from Singapore, enabling efficient just-in-time component sourcing. India has 276 operational SEZs with recent rule changes specifically supporting semiconductor and electronics manufacturing, including reduced land requirements (10 hectares vs 50) and permission to sell domestically. India's SEZ network is larger and offers more location flexibility.
What are the main risks of electronics manufacturing in each country?
In India, key risks include heavy compliance burden (FEMA reporting, transfer pricing, BIS certification), component import dependency of 75%, and potential bureaucratic delays. In Indonesia, risks include the archipelagic geography creating logistics complexity, smaller skilled labour pool, higher minimum capital requirements for foreign companies, and fewer sector-specific manufacturing incentives.