Why Manufacturing Location Decides Your India P&L
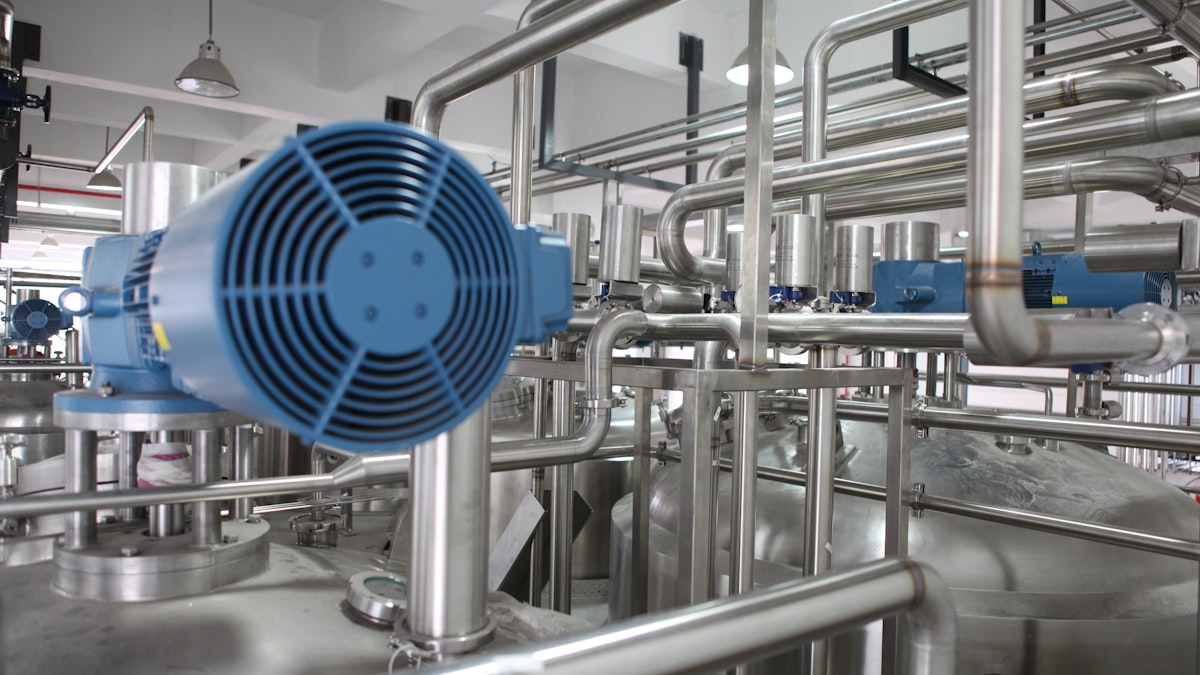
For foreign companies evaluating manufacturing in India, the choice of state is not a secondary operational detail — it is a strategic decision that directly determines unit economics. A factory producing identical goods in Gujarat versus Maharashtra can see a 20-30% difference in total operating costs due to variations in labour wages, industrial land prices, electricity tariffs, logistics proximity to ports, and state-level incentive structures.
India's manufacturing sector contributed approximately USD 330 billion to GDP in FY 2024-25, with five states — Tamil Nadu, Gujarat, Maharashtra, Uttar Pradesh, and Karnataka — accounting for over half of all factory output. Under the Production Linked Incentive (PLI) scheme, the central government has committed INR 1.97 lakh crore (USD 28 billion) across 14 sectors, but the actual cost competitiveness of your operation depends overwhelmingly on state-level factors that PLI incentives cannot fully offset.
This guide provides a data-driven comparison of manufacturing costs across India's major industrial states, with figures current as of March 2026. Whether you are setting up a wholly-owned subsidiary or a joint venture, this analysis will help you model costs accurately before committing capital.
Labour Costs: The Largest Variable
Labour costs represent 25-40% of total manufacturing costs in India, depending on the sector. India's wage structure is governed by the Code on Wages, 2019 (effective November 21, 2025), which replaced the Minimum Wages Act, 1948 and extended coverage to all workers. However, actual wage rates vary enormously by state, skill level, and industry.
Minimum Wage Comparison by State (2025-2026)
| State | Unskilled (INR/month) | Semi-Skilled (INR/month) | Skilled (INR/month) |
|---|---|---|---|
| Delhi NCR | 18,456 | 20,357 | 22,411 |
| Maharashtra | 14,500 | 15,800 | 17,200 |
| Karnataka | 13,800 | 15,200 | 16,900 |
| Tamil Nadu | 12,800 | 14,200 | 16,100 |
| Gujarat | 12,200 | 13,600 | 15,500 |
| Uttar Pradesh | 10,800 | 12,400 | 14,200 |
| Madhya Pradesh | 10,200 | 11,800 | 13,600 |
| Telangana | 13,200 | 14,800 | 16,500 |
| Andhra Pradesh | 11,500 | 13,200 | 15,000 |
| Rajasthan | 10,600 | 12,200 | 14,000 |
Beyond Minimum Wages: Actual Factory Floor Costs
Minimum wages are the legal floor, not the actual cost. In practice, manufacturing companies pay 20-50% above minimum wages to attract and retain workers, particularly in states with high industrial concentration. Total cost to company includes:
- Employee Provident Fund (EPF): 12% employer contribution on basic wages up to INR 15,000/month
- Employee State Insurance (ESI): 3.25% employer contribution for employees earning up to INR 21,000/month
- Professional Tax: Varies by state (INR 200/month in most states, INR 300 in Maharashtra for higher earners)
- Gratuity: 4.81% provisioning on basic wages
- Bonus: Statutory bonus of 8.33% of basic wages (minimum) under the Payment of Bonus Act
Total employer cost typically adds 25-35% to the gross wage. A skilled worker earning INR 16,000/month in Gujarat costs the employer approximately INR 20,000-21,600/month when all statutory contributions are included.
Tier 2 and Tier 3 City Advantage
Wages in Tier 2 and Tier 3 cities are 15-25% lower than in Tier 1 cities within the same state. For example, manufacturing wages in Hosur (Tamil Nadu) are materially lower than in Chennai, while Vadodara (Gujarat) offers cost advantages over Ahmedabad. The city compensatory allowance and conveyance allowance components shrink significantly in smaller cities, reducing the total wage bill.
Industrial Land Costs: State-by-State Comparison
Industrial land is typically acquired through state industrial development corporations (SIDCs) or private industrial parks. Prices vary dramatically based on location, infrastructure quality, and proximity to ports and highways.
Industrial Land Price Comparison (2025-2026)
| State / Zone | SIDC Land (INR/sq m) | Private Park (INR/sq m) | SEZ Land (INR/sq m) |
|---|---|---|---|
| Gujarat (GIDC zones) | 2,000-4,500 | 3,500-7,000 | 4,000-8,000 |
| Tamil Nadu (SIPCOT) | 2,500-5,500 | 4,000-8,500 | 5,000-10,000 |
| Maharashtra (MIDC) | 3,000-8,000 | 5,000-12,000 | 6,000-15,000 |
| Karnataka (KIADB) | 2,800-6,500 | 4,500-9,000 | 5,500-11,000 |
| Uttar Pradesh (UPSIDC) | 1,500-3,500 | 2,500-5,500 | 3,000-6,500 |
| Andhra Pradesh (APIIC) | 1,800-4,000 | 3,000-6,000 | 3,500-7,000 |
| Telangana (TSIIC) | 2,500-5,500 | 4,000-8,000 | 5,000-9,500 |
| Madhya Pradesh (MPIDC) | 1,200-3,000 | 2,000-4,500 | 2,500-5,000 |
| Rajasthan (RIICO) | 1,400-3,200 | 2,200-5,000 | 2,800-5,500 |
Gujarat and Uttar Pradesh offer the most competitive land costs, while Maharashtra commands a premium driven by proximity to Mumbai's port infrastructure and established supply chain ecosystems. The Special Economic Zone (SEZ) premium is typically 40-60% above SIDC rates but comes with duty exemptions and streamlined clearances that can offset the higher land cost for export-oriented units.
Lease vs Purchase Considerations
Most SIDCs offer land on a 99-year leasehold basis, not freehold. The upfront payment is typically 10-20% of total lease value, with the remainder payable in installments over 5-10 years. Foreign companies setting up through a private limited company structure can acquire industrial land; however, direct land acquisition by a branch office or liaison office is restricted under FEMA regulations.
Electricity Tariffs: The Hidden Cost Differentiator
Power costs are the second-largest operating expense for most manufacturing facilities, accounting for 10-25% of production costs depending on the industry (higher for energy-intensive sectors like steel, cement, and chemicals).
Industrial Electricity Tariff Comparison (FY 2025-26)
| State | HT Industrial (INR/kWh) | Demand Charge (INR/kVA/month) | Open Access Available |
|---|---|---|---|
| Gujarat | 5.80-6.50 | 250-350 | Yes (1 MW+) |
| Tamil Nadu | 7.25-7.50 | 300-400 | Yes (1 MW+) |
| Maharashtra | 7.00-8.50 | 350-450 | Yes (1 MW+) |
| Karnataka | 6.50-7.50 | 300-380 | Yes (1 MW+) |
| Uttar Pradesh | 6.80-8.00 | 280-350 | Yes (1 MW+) |
| Andhra Pradesh | 6.00-7.00 | 250-330 | Yes (1 MW+) |
| Telangana | 6.80-7.80 | 300-380 | Yes (1 MW+) |
| Madhya Pradesh | 6.20-7.00 | 250-320 | Yes (1 MW+) |
| Rajasthan | 6.50-7.50 | 260-340 | Yes (1 MW+) |
Open Access and Renewable Energy Options
Manufacturers consuming 1 MW or above can procure power through open access from third-party generators, often at rates 15-30% below state tariffs. Solar and wind power through open access or captive generation is now economically viable in most states, with levelized costs of INR 3.50-4.50/kWh for solar and INR 3.80-5.00/kWh for wind.
Gujarat and Rajasthan offer the most favourable conditions for captive solar installations due to high irradiance levels and supportive state policies. Many foreign manufacturers are achieving a blended power cost of INR 4.50-5.50/kWh by combining 60-70% renewable energy with grid backup.
Peak vs Off-Peak Rate Management
From July 2025, revised time-of-day tariffs introduced higher charges during peak hours (6:00 PM to 11:00 PM and 8:00 AM to 11:00 AM). Manufacturers who can schedule energy-intensive processes during off-peak hours (11:00 PM to 8:00 AM) can achieve savings of 10-20% on their power bill.

Logistics Costs: Port Proximity and Freight Economics
India's logistics cost stands at 7.97% of GDP (INR 24.01 lakh crore), according to the NCAER-DPIIT 2024 report. For manufacturing, logistics typically represents 8-14% of the cost of goods sold, making factory location relative to ports and consumption centres a critical variable.
State-wise Logistics Performance Rankings (2025)
| State | LEADS Score | Major Port | Container Handling Capacity |
|---|---|---|---|
| Maharashtra | 4.05 | JNPT (Nhava Sheva) | 6.0 million TEUs |
| Gujarat | 4.00 | Mundra, Kandla, Pipavav | 10+ million TEUs |
| Tamil Nadu | 3.95 | Chennai, Ennore, Tuticorin | 3.5 million TEUs |
| Karnataka | 3.90 | Mangalore, New Mangalore | 0.8 million TEUs |
| Andhra Pradesh | 3.75 | Visakhapatnam, Krishnapatnam | 1.5 million TEUs |
| Uttar Pradesh | 3.50 | Inland (Dadri ICD) | No major port |
Freight Cost Benchmarks
Road freight — the dominant mode for short to medium distances — ranges from INR 10 to 85 per kilometre depending on truck type and load. Rail freight is far more economical at approximately INR 1.96 per tonne-km, but availability of rail sidings and wagon allocation remain constraints.
For export-oriented manufacturers, the key metric is the delivered cost to the nearest container freight station (CFS) or port. Gujarat's Mundra Port handles 150 million tonnes annually and offers freight corridor connectivity that moves goods 20% faster than the national average. Chennai Port handles approximately 40% of India's container traffic, giving Tamil Nadu-based manufacturers a significant export advantage.
Dedicated Freight Corridors
The Western Dedicated Freight Corridor (connecting Delhi to JNPT via Gujarat) and Eastern Dedicated Freight Corridor (Delhi to Kolkata) have significantly reduced transit times and costs for manufacturers located along these routes. Factories in Gujarat, western Uttar Pradesh, and northern Maharashtra benefit most from these corridors.
State Incentive Packages: What Foreign Manufacturers Can Claim
Beyond central PLI schemes, each state offers its own package of manufacturing incentives through industrial policies typically valid for 5-7 year periods.
Key Incentive Comparison
| Incentive Type | Gujarat | Tamil Nadu | Maharashtra | UP | Karnataka |
|---|---|---|---|---|---|
| Capital subsidy | 15-25% | 15-30% | Up to 25% | 15-25% | 20-30% |
| Stamp duty exemption | 100% | 100% | 100% | 100% | 100% |
| Land at concessional rate | Yes (GIDC) | Yes (SIPCOT) | Yes (MIDC) | Yes (UPSIDC) | Yes (KIADB) |
| Power tariff subsidy | INR 1-2/unit | INR 1/unit | Case-by-case | INR 1-2/unit | INR 1/unit |
| SGST reimbursement | 50-100% | 50-100% | 50-100% | 75-100% | 50-100% |
| Employment incentive | Yes | Yes | Yes | Yes | Yes |
| Single window clearance | Yes | Yes | Yes | Yes | Yes |
Most state incentive packages require a minimum investment threshold (typically INR 10-50 crore for medium-scale and INR 100+ crore for large-scale) and minimum employment generation commitments. The incentive claim process requires filing with the state's industrial development department, typically within 12-24 months of commercial production.
Special Investment Regions
Gujarat's DMIC (Delhi-Mumbai Industrial Corridor) node at Dholera offers plug-and-play infrastructure with pre-approved environmental clearances. Tamil Nadu's industrial corridors along the Chennai-Bengaluru expressway and the Coimbatore-Salem belt are emerging as competitive alternatives. Uttar Pradesh's Noida and Greater Noida have become electronics manufacturing hotspots, with handset exports from the region exceeding USD 10 billion in FY 2024-25.

Sector-Specific Manufacturing Hub Analysis
India's manufacturing clusters are sector-specific, with decades of supply chain ecosystem development creating significant advantages for collocating within established clusters.
Automobiles and Components
The auto cluster spans three primary hubs: Chennai (Tamil Nadu), Pune (Maharashtra), and Gurgaon-Manesar (Haryana). Chennai alone houses plants of Hyundai, Renault-Nissan, BMW, and Royal Enfield. The density of Tier 1 and Tier 2 suppliers in these hubs reduces procurement lead times and enables just-in-time manufacturing. Foreign companies like German manufacturers have established a significant presence in Pune's auto corridor.
Electronics and Semiconductors
Noida (Uttar Pradesh) leads mobile device manufacturing, with Samsung, Foxconn, and Oppo operating major facilities. India's electronics production rose from INR 2.13 lakh crore in FY 2021 to INR 5.25 lakh crore in FY 2025 under PLI support. New semiconductor fabs are planned for Gujarat (Dholera), Odisha, Punjab, and Andhra Pradesh under the India Semiconductor Mission.
Pharmaceuticals
Gujarat's pharmaceutical belt (Ahmedabad-Vadodara-Bharuch-Ankleshwar-Vapi) generates approximately INR 1.42 trillion annually — about 35% of India's total pharmaceutical market. Hyderabad (Telangana) is the second major hub, particularly for bulk drug manufacturing and API production.
Textiles and Apparel
Tiruppur (Tamil Nadu) is the knitwear capital, while Surat (Gujarat) dominates synthetic textiles. Ludhiana (Punjab) specializes in woolen apparel. For foreign companies evaluating textile manufacturing, Tamil Nadu offers the deepest labour pool and strongest export infrastructure.
Total Cost of Manufacturing: A Worked Example
To illustrate how these cost components combine, consider a mid-sized electronics component manufacturing unit with 200 workers, operating in Gujarat versus Maharashtra:
| Cost Component | Gujarat (Ahmedabad) | Maharashtra (Pune) | Difference |
|---|---|---|---|
| Labour (200 workers, all-in monthly) | INR 38.0 lakh | INR 44.0 lakh | +15.8% |
| Land lease (5,000 sq m, annual) | INR 12.0 lakh | INR 22.0 lakh | +83.3% |
| Power (500 kW, monthly) | INR 7.5 lakh | INR 10.5 lakh | +40.0% |
| Logistics (to nearest port, per container) | INR 35,000 | INR 28,000 | -20.0% |
| Annual operating cost (approx.) | INR 7.2 crore | INR 9.3 crore | +29.2% |
Gujarat's lower labour and power costs provide a 29% operating cost advantage despite Maharashtra's proximity to JNPT port. However, the calculation shifts if your product requires proximity to Mumbai's financial ecosystem, specialized workforce, or specific supply chain linkages that Pune offers.

Setting Up Manufacturing: Entity and Compliance Structure
Foreign companies establishing manufacturing in India must navigate entity formation, FDI compliance, and state-level approvals simultaneously. The typical structure involves:
- Entity incorporation: Register a private limited company or wholly-owned subsidiary via SPICe+ form (10-15 business days)
- FDI compliance: File FC-GPR within 30 days of share allotment; submit annual FLA return to RBI
- GST registration: Required in every state where manufacturing or warehousing occurs
- IEC (Import Export Code): Mandatory for importing raw materials or exporting finished goods
- Factory licence: State-level Factories Act licence required before commencing operations
- Environmental clearance: Required for most manufacturing activities under the EIA Notification 2006
For a comprehensive guide on entity structuring decisions, see our branch office vs subsidiary comparison. If you are evaluating India alongside other manufacturing destinations, our China Plus One manufacturing analysis provides a detailed cross-country comparison.
Water and Utility Costs: An Overlooked Factor
Industrial water supply is a critical input for sectors like pharmaceuticals, food processing, chemicals, and textiles. Water costs and availability vary significantly by state and can be a make-or-break factor for water-intensive manufacturing.
State-wise Industrial Water Rates
| State | Industrial Water Rate (INR/kl) | Availability Rating |
|---|---|---|
| Gujarat (GIDC supply) | 35-55 | Good (Narmada canal network) |
| Tamil Nadu (SIPCOT supply) | 40-60 | Moderate (seasonal variation) |
| Maharashtra (MIDC supply) | 45-70 | Moderate to good |
| Karnataka (KIADB supply) | 40-65 | Moderate (Bengaluru region stressed) |
| Uttar Pradesh | 25-40 | Good (Gangetic plain) |
| Rajasthan | 50-80 | Poor (desert region, groundwater dependent) |
Most industrial zones provide piped water supply through the state industrial development corporation, but reliability varies. Manufacturing units in water-stressed regions should budget for borewell drilling (INR 5-15 lakh), rainwater harvesting infrastructure (mandatory in most states), and potentially water recycling and treatment plants (INR 20-50 lakh for a mid-sized facility). Zero liquid discharge (ZLD) requirements apply to certain industries in several states, adding INR 1-3 crore to setup costs.

Labour Availability and Skill Ecosystem
Beyond wage costs, the availability of skilled manufacturing labour varies significantly by state and directly impacts productivity, training costs, and attrition rates.
Industrial Training Infrastructure
India has approximately 15,000 Industrial Training Institutes (ITIs) producing 2.5 million skilled workers annually. Tamil Nadu has the highest concentration of ITIs per capita among manufacturing states, followed by Rajasthan and Gujarat. States with strong ITI networks produce workers with baseline certifications in CNC machining, welding, electrical work, and quality inspection — reducing the on-the-job training period from 6-9 months to 2-3 months.
Attrition and Retention Challenges
Manufacturing worker attrition in India averages 15-25% annually, with higher rates in industrial clusters where multiple employers compete for the same labour pool. The Noida electronics belt and Chennai auto corridor experience the highest attrition due to employer density. Strategies to manage attrition include providing company-operated transport (INR 500-1,000 per worker per month), subsidised canteen facilities, skill-based wage increments (quarterly versus annual), and dormitory accommodation in rural areas. Foreign manufacturers who invest in worker welfare infrastructure typically achieve attrition rates 8-12 percentage points below the cluster average, which translates into meaningful savings on recruitment and training costs over a 3-5 year period.
Key Takeaways
- Gujarat offers the lowest composite manufacturing costs across labour, land, and power, with Mundra Port providing strong export logistics — making it the default choice for cost-sensitive manufacturing
- Tamil Nadu leads for automobiles and textiles, with the deepest skilled labour pool and Chennai Port handling 40% of India's container traffic
- Maharashtra commands a cost premium but delivers proximity to India's financial capital, JNPT port, and the most established supply chain ecosystem
- Uttar Pradesh is the emerging value play, particularly for electronics manufacturing in the Noida belt, with the lowest land costs among major industrial states
- Total employer cost adds 25-35% to gross wages due to EPF, ESI, gratuity, and bonus — always model the all-in cost, not just minimum wages
- Open access renewable energy can reduce power costs by 15-30% below state tariffs, particularly in Gujarat and Rajasthan with high solar irradiance
Frequently Asked Questions
Which Indian state has the lowest manufacturing costs?
Gujarat generally offers the lowest composite manufacturing costs when combining labour wages, industrial land (GIDC zones from INR 2,000/sq m), electricity tariffs (INR 5.80-6.50/kWh), and port logistics through Mundra Port. Madhya Pradesh and Rajasthan also offer competitive costs but have weaker port connectivity.
What is the total employer cost per worker in India including statutory contributions?
Total employer cost adds 25-35% to the gross wage. This includes EPF (12%), ESI (3.25%), gratuity provisioning (4.81%), statutory bonus (8.33% minimum), and professional tax. A skilled worker earning INR 16,000/month in Gujarat costs approximately INR 20,000-21,600/month all-in.
Can foreign companies directly purchase industrial land in India?
Foreign companies operating through an Indian private limited company or wholly-owned subsidiary can acquire industrial land. However, branch offices and liaison offices face restrictions under FEMA regulations. Most industrial land is offered on 99-year leasehold through state industrial development corporations like GIDC, SIPCOT, or MIDC.
How much does industrial electricity cost in India per unit?
Industrial electricity tariffs in India range from INR 5.80 to INR 8.50 per kWh depending on the state. Gujarat offers the lowest rates at INR 5.80-6.50/kWh, while Maharashtra is among the highest at INR 7.00-8.50/kWh. Manufacturers consuming 1 MW+ can access open access power at 15-30% below state tariffs.
What government incentives are available for foreign manufacturers in India?
Foreign manufacturers can access both central PLI scheme incentives (INR 1.97 lakh crore across 14 sectors) and state-level packages including capital subsidies (15-30%), 100% stamp duty exemption, power tariff subsidies (INR 1-2/unit), SGST reimbursement (50-100%), and concessional land rates through state industrial development corporations.
What is the logistics cost as a percentage of GDP in India?
India's logistics cost stands at 7.97% of GDP (INR 24.01 lakh crore) per the NCAER-DPIIT 2024 report. For manufacturing specifically, logistics typically represents 8-14% of the cost of goods sold. Gujarat and Maharashtra rank highest on logistics performance due to major port infrastructure at Mundra and JNPT respectively.
Is it cheaper to manufacture in a Tier 2 city in India?
Yes, manufacturing in Tier 2 and Tier 3 cities is typically 15-25% cheaper than Tier 1 cities within the same state. Wages are lower due to reduced city compensatory allowance, industrial land is more affordable, and several states offer enhanced incentives for investments in backward or developing areas.